Economic dimension
The economic dimension of the Indicator Framework reflects the MRC’s intent to promote economic development in all riparian states through utilising the waters of the Mekong River system in a reasonable and equitable manner. The study areas are all fields of sustainable development, utilization, management, and conservation of water and related resources within the Mekong River Basin including, but not limited to, irrigation, hydro-power, navigation, flood control, fisheries, timber floating, recreation, and tourism. Three strategic indicators supported by eighteen assessment indicators have been selected to measure whether these objectives are being met.
↓ Scroll down to view the three strategic indicators supported by eigtheen assessment indicators
Note: The selected findings presented here should be interpreted considering the assumptions, methodologies and data sources of the SOBR 2018. For complete assessments, consult the SOBR 2018 report.
Aggregate economic value of water-related sectors
Assessment indicators:
- Economic value of agriculture
- Economic value of hydropower
- Economic value of navigation
- Economic value of sand mining
- Economic value of wetlands
- Economic value of capture fisheries
- Economic value of reservoir fisheries
- Economic value of aquaculture
- Economic value of forestry
- Economic value of tourism & recreation
- Economic losses from bank erosion
- Economic cost of flood damage
This Strategic Indicator is defined as the net economic output of water-related economic sectors in the Lower Mekong Basin. However, for the purposes of SOBR 2018, and due to data limitations, this has been modified to the “gross economic output of water-related sectors in the LMB”. Up to now, it has not been possible to assess all sectors due to data limitations.
Irrigated agriculture is the main water user in the basin. It has grown from virtually nil in the 1950’s to in excess of 5.7 million hectares (Mha) in 2013 (nearly 80% of which is in Viet Nam), with a total economic value of US$ 7.7 billion per year. As noted above, obtaining accurate figures on irrigation and irrigated coverage is not easy, particularly given that significant amounts of irrigation are in small schemes, which are not necessarily included in official records. However, given the likelihood and significance of a further expansion of irrigation, improved monitoring appears to be very important to guide strategic management of the basin.
Gross output value of irrigated rice in the LMB 2013
User guidance: You can sort the table by clicking on the column headers.
The Mekong Basin has considerable potential for hydropower development, serving both domestic and export markets, enhancing both regional economic integration and energy security. By 2015, 59 hydropower projects of between 1 MW and 4,200 MW had been developed in the LMB with a total installed capacity of 10,017 MW, representing some 35% of the total estimated technical hydropower potential of the LMB. The gross economic value of hydropower production has increased from US$ 0.55 billion per year in 2005 to over US$ 2 billion in 2015 (excluding investment and other related development costs), over 50% of which accrues to Lao PDR with a further 40% to Viet Nam.
Gross economic value of LMB hydropower production
User guidance: You can sort the table by clicking on the column headers.
The Mekong River has long been an important inland waterway for traditional cargo and passenger transport between the numerous riverine communities along the Mekong. In addition, the river has also emerged as an increasingly important international trade route connecting the six riparian states, and the lower reaches of the basin to the sea and wider international markets. The Inland waterway transport (IWT) cargo in 2007 was worth US$ 6.8 billion annually and, notwithstanding stiff competition from road transport, IWT cargo has since risen to 23 million tons in 2014. Over the same period, total passenger numbers have risen from 37.6 million to 69.4 million annually, over 800,000 of whom were tourists.
Sand mining in the LMB is extensive and provides a critical input into construction and industrial sectors. Extraction of sand in the region has increased rapidly with increased demand, much of which has been driven by infrastructure upgrading on the delta, as well as for export to regional markets. Data for sand and sediment mining activities in the basin is not systematically collected, but the sector is believed to be worth in the order of US$ 175 million annually.
Sediment extraction volumes and percentage of grain-size categories per country in 2011
User guidance: You can sort the table by clicking on the column headers.
An evaluation has been made of wetlands and the services they provide. Although there are a number of caveats to the method used, the annual value of wetlands in 2010 is estimated at US$ 2.9 billion, down from US$ 3.6 billion in 2003. This fall was due to a 20% reduction in the extent of wetlands during the period. It seems probable that the current value is somewhat less for similar reasons.
The overall unit value of capture fisheries in the LMB is derived from first-sale prices of a wide variety of fish species. Based on average first-sale prices in each of the four Member Countries, the economic value of the 2.3 million tonnes of annual capture fish production was calculated at approximately US$ 11.2 billion, representing about 65% of the total value of all types of fisheries production. Of this, the economic value from capture fisheries is largest in Thailand at US$ 6.3 billion with Cambodia next at US$ 2.8 billion annually.
Capture Fisheries values (US$ million)
User guidance: You can sort the table by clicking on the column headers.
The economic value of reservoir fisheries is significantly lower based on a yield of 230,000 tons annually, which was worth US$1.2 billion in 2015, up from US$ 0.7 billion in 2010. In contrast, aquaculture has grown rapidly and was valued in 2015 at US$ 5.8 billion, up from US$4.6 billion in 2010 and US$0.7 billion in 2003. Viet Nam is by far the largest producer, accounting for 86%.
Aquaculture values (US$ million)
User guidance: You can sort the table by clicking on the column headers.
Timber is an important good supplied from the forests of the LMB. At present, and despite regulation, wood is not extracted in a sustainable manner in some LMB countries and is a key source of forest loss. Initial estimates made of forestry output value in the LMB suggest that the annual sustainable fuelwood production in the LMB in 2010 was worth up to US$ 0.4 billion, and that by 2016 the gross economic value of annual sustainable timber production in the LMB was estimated US$ 1.4 billion.
Since 1980, international tourism has developed rapidly in all the LMB countries. Tourism now makes an important contribution to GDP in all the LMB countries, ranging from 5% in Viet Nam to 11% in Cambodia. In 2016, the LMB countries attracted around 51 million international visitors generating approximately US$65 billion. However, figures for tourism to the LMB specifically are available, although the national figures for Cambodia (US$3.5 billion in 2016) and Lao PDR (US$0.7 billion in 2016) may provide a guide to international tourism in the LMB in these two countries (but not so in Thailand and Viet Nam as most of their tourist sites are outside the basin). Nevertheless, the value of tourism to the basin is clear, as is the rapid growth in the sector. In this context, it is important to stress the significance of sustaining riverine environments in order to continue attracting tourists.
LMB International tourism arrivals and receipts 2006 and 2016
User guidance: You can sort the table by clicking on the column headers.
Estimates of river bank and coastal erosion have been calculated for the LMB countries with the exception of Thailand. These show a wide disparity between estimates of eroded area between countries, reflecting possibly different geomorphological conditions, gaps in the data, and also different assessment methodologies all of which make comparisons difficult. Over the seven-year period, the value of land lost in Lao PDR is in aggregate estimated to be US$ 0.7 million, or about US$ 100,000 per year. Estimates for Cambodia have not been possible and reported losses in Viet Nam in recent years, whilst prompting concern, are very limited. However, coastal erosion is seen as a large and growing problem in the delta, where it has been estimated that 500 ha of land is lost annually, worth approximately US$ 12.5 million per year.
The economic value of flood damages is annually reported by the Member Countries for the Annual Mekong Flood Reports. Data for 2010-2014 shows that the annual cost varied between US$ 0.02 billion (2012) up to US$ 0.5 billion (2011), with an average of this 5-year period (2010-2014) of US$ 0.2 billion per year. Damages and losses are indicated for floods in general, but damages and losses related to river floods or flash floods are not specified. While this is too short a time-series to determine a trend with any confidence, there is some indication that damages are increasing, probably as a consequence of greater investment in areas susceptible to flooding.
Overall, in aggregate, the annual economic value of the water-related sectors listed above is almost US$ 35 billion per year, excluding tourism and forestry.
Contribution to basin economy
Assessment indicators:
- Contribution to national GDP
- Contribution to national food grain demand
- Contribution to national protein demand
- Contribution to national power demand from basin hydropower
- Annual basin hydroelectric production
The contribution made by the water-related sectors to the basin economy is defined as their contribution to overall economic, food, and energy security within the basin and beyond. These contributions are measured by assessment indicators covering contributions to national GDP, food grain supply, protein supply, and power supply.
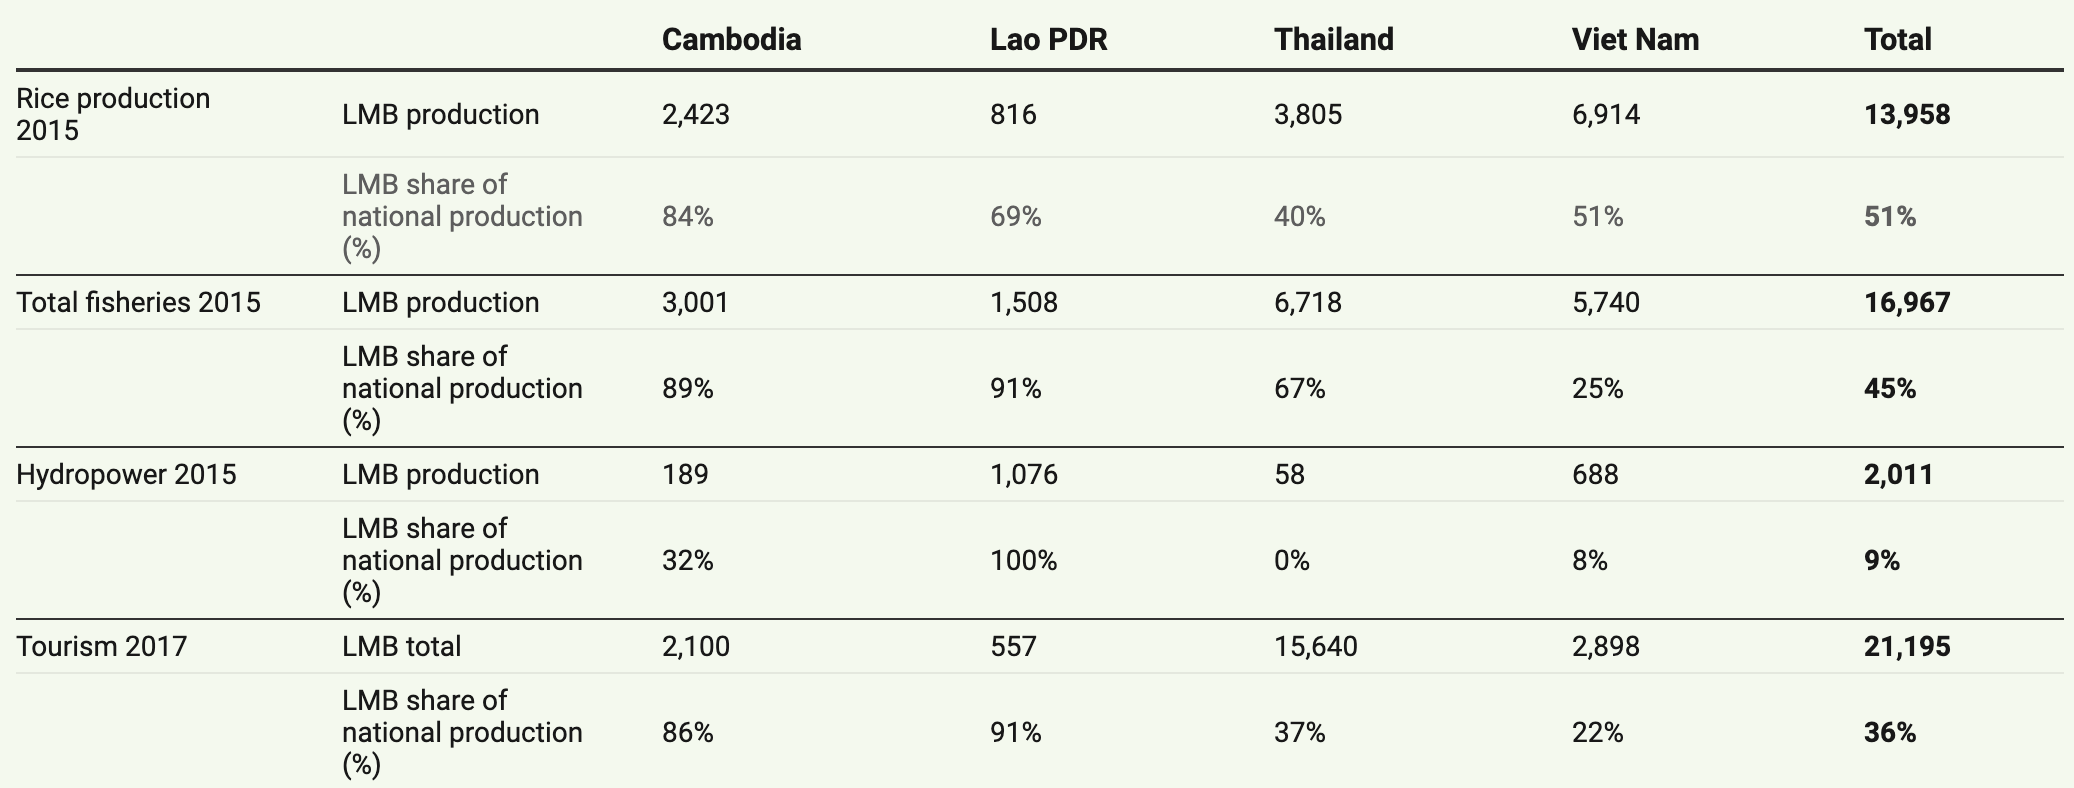
The data required to calculate the contribution of all MRC water-related sectors in the LMB to national GDP or sectoral GDP was not available. However, sufficient data was available to allow an estimation of the share of key MRC water-related sectors attributable to production in the LMB, namely rice production, fisheries, hydropower, and tourism.
The share of national rice production within LMB areas of Cambodia (84%) and Lao PDR (69%) is high, reflecting the large proportion of these countries within the LMB. The share of national rice production produced in the LMB areas of Thailand and Viet Nam is lower at around 40-51%, reflecting the large proportion of these countries outside the LMB. Overall, the LMB produced 48.2 million tons of rice in 2013, around 51% of the 93.6 million tons of rice produced in the four LMB countries as a whole.
As a percentage of total national demand, Protein supply from the rice sectors in 2013 and 2014 represented 58% for Viet Nam, 68% for Thailand, up to 131% for Lao PDR, and 152% for Cambodia. The fisheries sector (capture, reservoir and aquaculture) met 8% (Viet Nam) and 25% (Cambodia) of national demand of the LMB countries.
LMB hydropower sources are clearly important for all LMB countries, accounting for 10% of electricity demand. According to the available data, Lao PDR obtains practically all its supply from LMB hydropower. Cambodia also obtains over a third of its electricity supply from hydropower plants in the basin. Thailand has the lowest share of LMB hydropower in its generation mix, including significant hydropower imports from Lao PDR. Finally, Viet Nam also generates around 9% of its demand in the LMB from plants in the central highlands.
The broad picture of the LMB (as is the case of the LMB countries) is one of economic growth and productivity improvement. This is clear from increased production in sectors such as rice production and hydropower generation, as well as navigation, tourism, and aquaculture. Overall, water and water-related sectors in the LMB remain significant contributors to the national economies of LMB countries. The high shares of national production in all these sectors in Cambodian and Lao portions of the basin reflects the share of national territory of these countries in the basin. Conversely, the lower share of LMB located production in these sectors in national production in Thailand and Viet Nam reflects their lower share of national territory in the LMB.
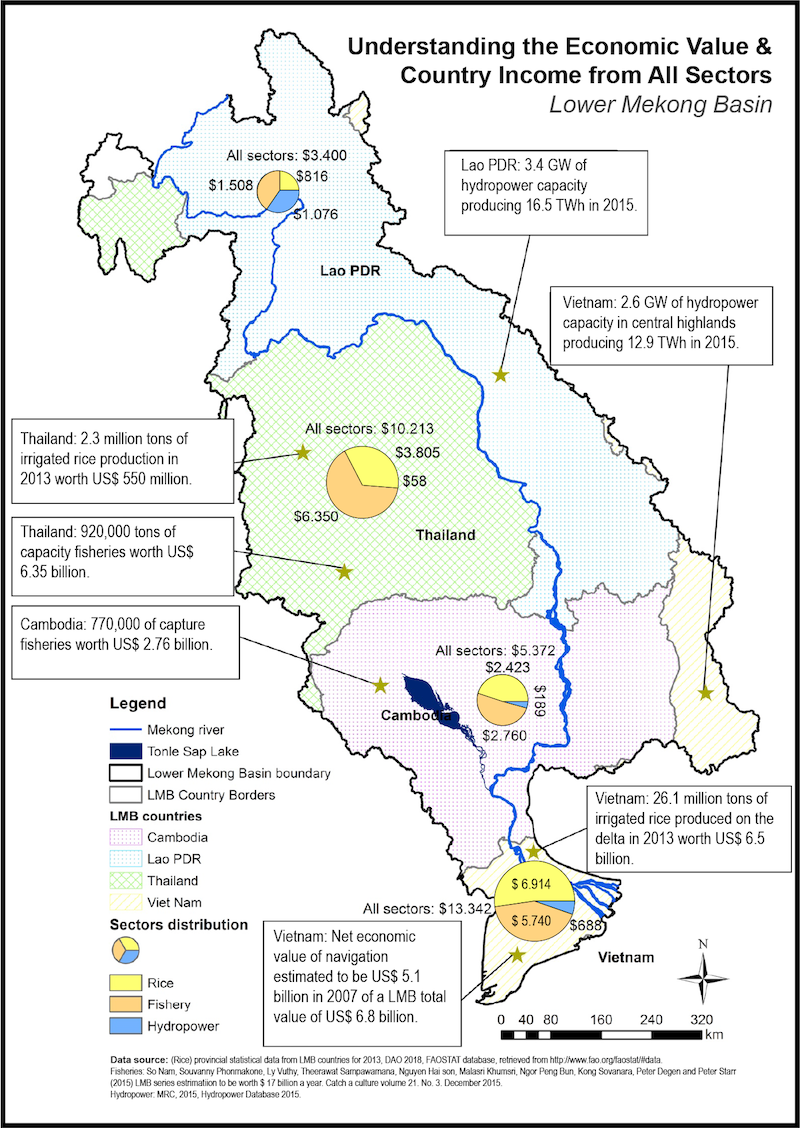
Production of the water-related sectors within the LMB (US$ million)