Overall assessments
This page includes the findings on predicted GDP ranges, poverty levels, changes in natural capital, and the sustainability index across different scenarios.
↓ Scroll down to view details
Note: The selected findings presented here should be interpreted considering the assumptions, methodologies and data sources of the Council Study. For complete assessments, consult the Council Study reports.
GDP ranges*
GDP ranges for 2040 under various development scenarios for the LMB
The comparison of the scenarios suggests that the macro-economic optimum requires lower agricultural expansion than assumed for 2020 plans, some hydropower projects, but fewer than assumed for 2040 plans and fewer mainstream dams than assumed for 2020 plans.
* The GDP ranges reflect sector effects in a macro-economic perspective. Sectors are linked because they require similar production factors as inputs (e.g. labour, capital, natural resources) and compete for the same household (or public) budget. For the GPD projections, input-output data, household survey data, and population growth projections are combined with sector-specific assessment results (the NPVs) to estimate ranges of possible GDP trajectories.
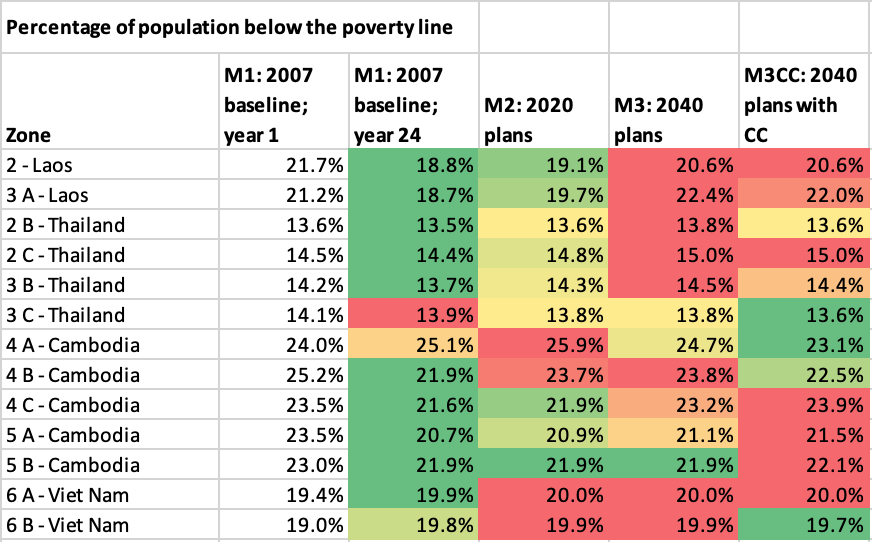
User guidance: Click on a SIMVA corridor zone to show poverty levels under different scenarios.
Poverty levels**
Poverty levels in SIMVA corridor zones under different scenarios
There are modest changes in poverty levels across the main scenarios for all SIMVA corridor zones in the LMB. For the majority of zones, the highest poverty levels exist under the 2040 scenarios.
** Poverty levels were estimated as the 25th percentile of aggregate individual income (mainly based on rice and fish production for the different scenarios) combining males and females. Data was derived from the Social Impact Monitoring and Vulnerability Assessment (SIMVA, 2011) and the Exploring Mekong Region Futures (EMRF, 2012) surveys. Poverty levels correspond approximately to national poverty lines for rural areas.
Natural capital
Changes in natural capital
Agricultural and hydropower development erode natural capital. 2020 plans may cause a loss in natural capital of $51 billion in NPV of which two-thirds would result from deforestation to expand agricultural areas (actual loss until 2015). The remaining third would be from losses in fisheries. 2040 plans would reverse the trend due to reforestation plans, which would increase natural capital by about $53 billion in NPV despite large losses in fisheries. The combination of substantial agricultural expansion and extensive reforestation is, however, highly challenging, particularly as urbanisation continues to rise.
User guidance: You can interact with the chart by clicking on the legend fields or moving the cursor over the bars.
Sustainability index***
Sustainability index across different scenarios
The comparison of the scenarios shows that the 2020 and 2040 plans are likely to result in sustainability losses.
*** The sustainability index is based on the UN Sustainable Development Goals covering social, environmental and economic dimensions of the MRC Indicator Framework. Due to limited data, not all sub-indicators could be covered. Therefore, the absolute values of the current sustainability index (with 14 per country being the maximum) are subordinate to the ordinal comparison between scenarios, which is more robust and unlikely to change after adding indicators.